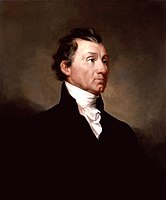
1820 United States presidential election in Kentucky | ← 1816 | 1 November – 6 December 1820 | 1824 → |
|
| |  | | | Nominee | James Monroe | | | | Party | Democratic-Republican | | | Home state | Virginia | | | Running mate | Daniel D. Tompkins | | | Electoral vote | 12 | | | Popular vote | 2,729 | | | Percentage | 58.44% | | |
 County results County results Electoral district results Electoral district results | Monroe 50–60% 60–70% 70–80% 80–90% 90-100% | Federalist 50–60% | |
| Elections in Kentucky |
|---|
 |
| |
| |
| |
| |
| |
 Government Government |
|
The 1820 United States presidential election in Kentucky took place between 1 November and 6 December 1820, as part of the 1820 United States presidential election. Voters chose twelve representatives, or electors to the Electoral College, who voted for President and Vice President.[1]
Kentucky cast twelve electoral votes for the Democratic-Republican candidate and incumbent President James Monroe, as he ran effectively unopposed. The electoral votes for Vice president were cast for Monroe's running mate Daniel D. Tompkins from New York. The state was divided into three electoral districts with four electors each, whereupon each district's voters chose the electors through block voting. Monroe electors ran unopposed in Districts 1 and 3. In District 2, a single Federalist elector pledged to Monroe ran, winning more votes than the best performing Monroe elector.[1]
Results
| 1820 United States presidential election in Kentucky[1] |
| Party | Candidate | Votes | Percentage | Electoral votes |
| | Democratic-Republican | James Monroe (incumbent) | 2,729 | 58.44% | 12 |
| | Federalist | | 1,941 | 41.56% | 0 |
| Totals | 4,670 | 100.0% | 12 |
Results by electoral district
Results by District[1] | District | James Monroe Democratic-Republican | Federalist | Margin | Total Votes Cast |
| # | % | Electors | # | % | Electors | # | % |
| 1 | No Data | 100% | 4 | no candidates | No Data | 100% | No Data |
| 2 | 1,471 | 43.11% | 3 | 1,941 | 56.89% | 1 | -470 | -13.78% | 3,412 |
| 3 | 1,258 | 100% | 4 | no candidates | 1,258 | 100% | 1,258 |
| Total | 2,729 | 58.44% | 12 | 1,941 | 41.56% | 0[a] | 788 | 16.88% | 4,670 |
Notes
- ^ The single Federalist elector voted for Monroe
See also
References
- ^ a b c d "A New Nation Votes". elections.lib.tufts.edu. Retrieved July 9, 2023.
|
|---|
|
- See also
- Presidential elections
- Senate elections
- House elections
- Gubernatorial elections
|
 County results
 Electoral district results


