1987 UK local government election
1987 Bath City Council election |
17 of 48 seats (one third plus one vacant seat) to Bath City Council
24 seats needed for a majority |
|---|
| |
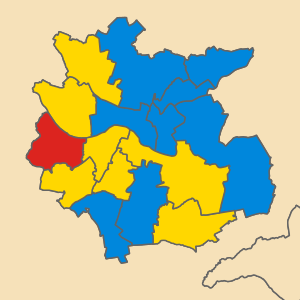 Map showing the results of the 1987 Bath City Council elections. Blue showing Conservative, Red showing Labour and Yellow showing SDP–Liberal Alliance. |
Council control before election
Conservative
| Council control after election
No overall control
| |
The 1987 Bath City Council election was held on Thursday 7 May 1987 to elect councillors to Bath City Council in England. It took place on the same day as other district council elections in the United Kingdom. One third of seats were up for election. Two seats were contested in Walcot due to an extra vacancy occurring.
Results summary
| Bath City Council election, 1987 |
| Party | This election | Full council | This election |
| Seats | Net | Seats % | Other | Total | Total % | Votes | Votes % | +/− |
| | Conservative | 9 |  2 2 | 52.9% | 15 | 24 | 50% | 15,053 | 40.0% |  4% 4% |
| | Alliance | 7 | 6 | 41.2% | 9 | 16 | 33.3% | 13,993 | 37.2% | 0.9% |
| | Labour | 1 | 4 | 5.9% | 7 | 8 | 16.7% | 7,885 | 21.0% | 6.7% |
Ward results
Sitting councillors seeking re-election, elected in 1983, are marked with an asterisk (*). The ward results listed below are based on the changes from the 1986 elections, not taking into account any party defections or by-elections.
Abbey
Abbey[1] | Party | Candidate | Votes | % | ±% |
| | Conservative | Elgar Spencer Jenkins * | 1,036 | 50.3 | +4.4 |
| | Alliance | Adrian Pegg | 606 | 29.4 | –2.1 |
| | Labour | G. Stevens | 330 | 16.0 | –6.6 |
| | Green | K. Bateup | 86 | 4.2 | N/A |
| Majority | 430 | 20.9 | |
| Turnout | | 46.2 | |
| Registered electors | 4,458 | | |
| | Conservative hold | Swing | | |
Bathwick
Bathwick[1] | Party | Candidate | Votes | % | ±% |
| | Conservative | G. O'Donovan * | 1,309 | 60.9 | +0.5 |
| | Alliance | Kenneth Drain | 545 | 25.3 | –2.8 |
| | Labour | H. Hornblower | 202 | 9.4 | –2.2 |
| | Green | J. Goodyer | 95 | 4.4 | N/A |
| Majority | 764 | 35.5 | |
| Turnout | | 46.2 | |
| Registered electors | 4,651 | | |
| | Conservative hold | Swing | | |
Bloomfield
Bloomfield[1] | Party | Candidate | Votes | % | ±% |
| | Conservative | Eric Jack Trevor Snook * | 1,097 | 46.7 | +6.7 |
| | Labour | S. Lydiard | 779 | 33.2 | –3.3 |
| | Alliance | M. Le Grice | 471 | 20.1 | –3.4 |
| Majority | 318 | 13.5 | |
| Turnout | | 57.3 | |
| Registered electors | 4,097 | | |
| | Conservative hold | Swing | | |
Combe Down
Combe Down[1] | Party | Candidate | Votes | % | ±% |
| | Alliance | Jane Tyler | 1,286 | 50.4 | +3.0 |
| | Conservative | Leila Margaret Wishart * | 1,057 | 41.5 | +5.0 |
| | Labour | D. Davis | 207 | 8.1 | –8.0 |
| Majority | 229 | 9.0 | |
| Turnout | | 62.7 | |
| Registered electors | 4,067 | | |
| | Alliance gain from Conservative | Swing | | |
Kingsmead
Kingsmead[1] | Party | Candidate | Votes | % | ±% |
| | Conservative | David Hawkins | 858 | 45.5 | +0.2 |
| | Alliance | F. Bovett | 664 | 35.2 | +6.7 |
| | Labour | P. Hardy | 365 | 19.3 | –6.7 |
| Majority | 194 | 10.3 | |
| Turnout | | 45.8 | |
| Registered electors | 4,118 | | |
| | Conservative hold | Swing | | |
Lambridge
Lambridge[1] | Party | Candidate | Votes | % | ±% |
| | Conservative | H. McDermid * | 770 | 40.2 | –0.5 |
| | Alliance | Paul Crossley | 652 | 34.1 | +5.2 |
| | Labour | N. Carter | 453 | 23.7 | –6.7 |
| | Green | C. Turner | 39 | 2.0 | N/A |
| Majority | 118 | 6.2 | |
| Turnout | | 62.5 | |
| Registered electors | 3,061 | | |
| | Conservative hold | Swing | | |
Lansdown
Lansdown[1] | Party | Candidate | Votes | % | ±% |
| | Conservative | Anne Maureen McDonagh * | 1,383 | 59.0 | +8.2 |
| | Alliance | P. Buckingham | 682 | 29.1 | –3.5 |
| | Labour | E. Crawley | 200 | 8.5 | –8.2 |
| | Green | M. Gordon | 81 | 3.5 | N/A |
| Majority | 701 | 29.9 | |
| Turnout | | 58.2 | |
| Registered electors | 4,032 | | |
| | Conservative hold | Swing | | |
Lyncombe
Lyncombe[1] | Party | Candidate | Votes | % | ±% |
| | Conservative | Brian James Hamlen * | 1,296 | 49.5 | +2.3 |
| | Alliance | S. Ible | 1,020 | 39.0 | –1.1 |
| | Labour | D. Robinson | 232 | 8.9 | –3.7 |
| | Green | L. Jopling | 70 | 2.7 | N/A |
| Majority | 276 | 10.5 | |
| Turnout | | 59.9 | |
| Registered electors | 4,372 | | |
| | Conservative hold | Swing | | |
Newbridge
Newbridge[1] | Party | Candidate | Votes | % | ±% |
| | Alliance | S. Sutherland | 1,312 | 49.5 | +7.3 |
| | Conservative | D. Book | 1,150 | 43.4 | +1.9 |
| | Labour | C. Whitmarsh | 188 | 7.1 | –9.2 |
| Majority | 162 | 6.1 | |
| Turnout | | 60.0 | |
| Registered electors | 4,418 | | |
| | Alliance gain from Conservative | Swing | | |
Oldfield
Oldfield[1] | Party | Candidate | Votes | % | ±% |
| | Alliance | D. Gregory | 1,059 | 43.4 | –7.3 |
| | Labour | D. Pearce * | 924 | 37.8 | +1.1 |
| | Conservative | R. Hall | 459 | 18.8 | +6.1 |
| Majority | 135 | 5.5 | |
| Turnout | | 57.5 | |
| Registered electors | 4,154 | | |
| | Alliance gain from Labour | Swing | | |
Southdown
Southdown[1] | Party | Candidate | Votes | % | ±% |
| | Alliance | A. Bovett | 1,078 | 50.3 | +3.8 |
| | Labour | S. Weston * | 631 | 29.4 | –9.7 |
| | Conservative | M. Sykes | 436 | 20.3 | +5.9 |
| Majority | 447 | 20.8 | |
| Turnout | | 53.2 | |
| Registered electors | 4,033 | | |
| | Alliance gain from Labour | Swing | | |
Twerton
Twerton[1] | Party | Candidate | Votes | % | ±% |
| | Labour | Alec Louis Ricketts * | 1,013 | 61.2 | –4.1 |
| | Alliance | Michael Twohig | 312 | 18.9 | –1.4 |
| | Conservative | J. Cameron | 302 | 18.2 | +3.7 |
| | Green | B. Searle | 28 | 1.7 | N/A |
| Majority | 701 | 42.4 | |
| Turnout | | 41.8 | |
| Registered electors | 3,969 | | |
| | Labour hold | Swing | | |
Walcot
Walcot (2 seats)[1] | Party | Candidate | Votes | % | ±% |
| | Conservative | P. Goodhart | 847 | 36.2 | +2.4 |
| | Conservative | Howard William Routledge * | 792 | – | |
| | Labour | S. King | 659 | 28.1 | –13.8 |
| | Alliance | Margaret Feeny | 657 | 28.1 | +3.7 |
| | Labour | D. Nicoll | 594 | – | |
| | Alliance | A. Stevenson | 492 | – | |
| | Green | Derek Wall | 179 | 7.6 | N/A |
| Turnout | | 61.6 | |
| Registered electors | 3,805 | | |
| | Conservative hold | Swing | | |
| | Conservative gain from Labour | Swing | | |
Westmoreland
Westmoreland[1] | Party | Candidate | Votes | % | ±% |
| | Alliance | John Bryant | 732 | 38.8 | +11.4 |
| | Labour | D. Book * | 709 | 37.5 | –16.6 |
| | Conservative | D. Ashdown | 448 | 23.7 | +5.2 |
| Majority | 23 | 1.2 | |
| Turnout | | 48.3 | |
| Registered electors | 3,915 | | |
| | Alliance gain from Labour | Swing | | |
Weston
Weston[1] | Party | Candidate | Votes | % | ±% |
| | Alliance | John James Malloy * | 1,414 | 56.5 | +6.3 |
| | Conservative | P. Blair | 906 | 36.2 | +0.6 |
| | Labour | W. Chivers | 144 | 5.8 | –8.4 |
| | Green | L. Barnes | 39 | 1.6 | N/A |
| Majority | 508 | 20.3 | |
| Turnout | | 60.1 | |
| Registered electors | 4,168 | | |
| | Alliance hold | Swing | | |
Widcombe
Widcombe[1] | Party | Candidate | Votes | % | ±% |
| | Alliance | Tony Clark | 1,011 | 45.7 | +1.3 |
| | Conservative | H. Cross * | 907 | 41.0 | +6.1 |
| | Labour | I. Roker | 255 | 11.5 | –9.3 |
| | Green | P. Hardman | 40 | 1.8 | N/A |
| Majority | 104 | 4.7 | |
| Turnout | | 57.2 | |
| Registered electors | 3,870 | | |
| | Alliance gain from Conservative | Swing | | |
References
- ^ a b c d e f g h i j k l m n o p "Bath City Council Election Results 1973-1994" (PDF). The Elections Centre (Plymouth University). Retrieved 18 April 2020.

 2
2  4%
4%  Council elections in Somerset


