2021 UK local government election
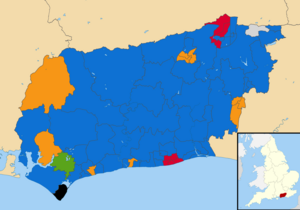
The West Sussex County Council election took place on 6 May 2021 alongside other local elections. All 70 seats to West Sussex County Council were elected.[1] Labour gained 4 seats in the Worthing division, while the Green Party and Local Alliance gained their first ever seats on the council.[2]
Summary
Election result
| 2021 West Sussex County Council election |
| Party | Candidates | Seats | Gains | Losses | Net gain/loss | Seats % | Votes % | Votes | +/− |
| | Conservative | 70 | 48 | 3 | 11 |  8 8 | 68.6 | 46.7 | 112,801 | –4.6 |
| | Liberal Democrats | 65 | 10 | 4 | 3 |  1 1 | 14.3 | 19.5 | 47,164 | +0.3 |
| | Labour | 67 | 9 | 5 | 1 | 4 | 12.9 | 19.2 | 46,324 | +3.7 |
| | Green | 56 | 1 | 1 | 0 | 1 | 1.4 | 10.2 | 24,721 | +5.1 |
| | Independent | 13 | 1 | 1 | 0 | 1 | 1.4 | 3.1 | 7,437 | +0.7 |
| | Local Alliance | 1 | 1 | 1 | 0 | 1 | 1.4 | 0.7 | 1,733 | N/A |
| | Reform UK | 6 | 0 | 0 | 0 |  | 0.0 | 0.2 | 559 | N/A |
| | For Britain | 8 | 0 | 0 | 0 | | 0.0 | 0.2 | 419 | N/A |
| | Peace | 1 | 0 | 0 | 0 | | 0.0 | 0.1 | 208 | +0.1 |
| | Monster Raving Loony | 1 | 0 | 0 | 0 | | 0.0 | 0.1 | 122 | +0.1 |
| | Democratic Network | 1 | 0 | 0 | 0 | | 0.0 | <0.1 | 90 | N/A |
| | Libertarian | 1 | 0 | 0 | 0 | | 0.0 | <0.1 | 78 | N/A |
| | TUSC | 1 | 0 | 0 | 0 | | 0.0 | <0.1 | 37 | N/A |
| | Patria | 1 | 0 | 0 | 0 | | 0.0 | <0.1 | 32 | ±0.0 |
Results by division
Adur
Lancing | Party | Candidate | Votes | % | ±% |
| | Conservative | Andy McGregor | 1,632 | 48.8 | +4.4 |
| | Labour | Lee Cowen | 1,203 | 36.0 | +18.4 |
| | Liberal Democrats | Doris Martin | 264 | 7.9 | −6.2 |
| | Green | Russell Whiting | 243 | 7.3 | +0.9 |
| Majority | 429 | 12.8 | −14.0 |
| Turnout | 3,342 | 33.4 | +2.3 |
| | Conservative hold | Swing | 7.0 | |
Shoreham North | Party | Candidate | Votes | % | ±% |
| | Conservative | Emma Evans | 1,648 | 41.7 | −9.6 |
| | Labour | Deborah Stainforth | 1,482 | 37.5 | +15.3 |
| | Liberal Democrats | Nico Kearns | 460 | 11.6 | +2.6 |
| | Green | Anne Younger | 364 | 9.2 | +1.2 |
| Majority | 166 | 4.2 | −24.9 |
| Turnout | 3,954 | 39.1 | +10.0 |
| | Conservative hold | Swing | 12.5 | |
Shoreham South | Party | Candidate | Votes | % | ±% |
| | Conservative | Kevin Boram | 1,671 | 37.8 | −8.5 |
| | Labour | Catherine Arnold | 1,544 | 34.9 | +9.9 |
| | Green | Leslie Groves-Williams | 906 | 20.5 | +9.5 |
| | Liberal Democrats | Neville Pressley | 301 | 6.8 | −3.7 |
| Majority | 127 | 2.9 | −18.4 |
| Turnout | 4,422 | 46.5 | +8.6 |
| | Conservative hold | Swing | 9.2 | |
Sompting and North Lancing | Party | Candidate | Votes | % | ±% |
| | Conservative | Carson Albury | 2,009 | 58.9 | +7.2 |
| | Labour | Cathy Glynn-Davies | 745 | 21.8 | +3.9 |
| | Green | Lynn Finnigan | 301 | 8.8 | +4.7 |
| | Liberal Democrats | Steve Male | 290 | 8.5 | −1.2 |
| | For Britain | Mike Glennon | 66 | 1.9 | N/A |
| Majority | 1,264 | 37.1 | +3.3 |
| Turnout | 3,411 | 33.5 | +0.2 |
| | Conservative hold | Swing | 1.7 | |
Southwick | Party | Candidate | Votes | % | ±% |
| | Conservative | Angus Dunn | 1,751 | 50.9 | −0.7 |
| | Labour | Steve Gilbert | 1,200 | 34.9 | +6.1 |
| | Green | Patrick Ginnelly | 258 | 7.5 | +2.6 |
| | Liberal Democrats | Ian Jones | 228 | 6.6 | −0.9 |
| Majority | 551 | 16.0 | −6.8 |
| Turnout | 3,411 | 33.5 | +2.1 |
| | Conservative hold | Swing | 3.4 | |
Arun
Angmering and Findon | Party | Candidate | Votes | % | ±% |
| | Conservative | Deborah Urquhart | 1,597 | 55.7 | −5.8 |
| | Liberal Democrats | Louisa Fowles | 754 | 26.3 | +8.1 |
| | Labour | Alison Baker | 310 | 10.8 | −2.7 |
| | Green | Chris Medland | 207 | 7.2 | N/A |
| Majority | | | |
| | Conservative hold | Swing | | |
Arundel and Courtwick | Party | Candidate | Votes | % | ±% |
| | Conservative | Gary Markwell | 1,361 | 52.9 | −3.4 |
| | Liberal Democrats | Nick Rusbridge | 517 | 20.1 | +6.7 |
| | Labour | Michael Ward | 348 | 13.5 | −3.6 |
| | Green | Richard Smith | 346 | 13.5 | +7.8 |
| Majority | | | |
| | Conservative hold | Swing | | |
Bersted | Party | Candidate | Votes | % | ±% |
| | Conservative | Keir Greenway | 1,040 | 37.3 | +3.9 |
| | Independent | Paul Wells | 676 | 24.5 | N/A |
| | Liberal Democrats | Gill Yeates | 633 | 23.0 | +3.3 |
| | Labour | Nigel Smith | 409 | 14.8 | +0.3 |
| Turnout | | | |
| | Conservative hold | Swing | | |
Bognor Regis East | Party | Candidate | Votes | % | ±% |
| | Liberal Democrats | Francis Oppler | 689 | 31.7 | −7.0 |
| | Conservative | Steve Reynolds | 612 | 28.2 | +2.3 |
| | Independent | Steve Goodheart | 329 | 15.1 | +6.4 |
| | Labour | Roger Nash | 285 | 13.1 | −1.2 |
| | Green | Chloe Wilkinson | 136 | 6.3 | +3.0 |
| | Independent | Phil Woodall | 123 | 5.7 | N/A |
| Majority | | | |
| | Liberal Democrats hold | Swing | | |
Bognor Regis West and Aldwick | Party | Candidate | Votes | % | ±% |
| | Conservative | Ashvin Patel | 1,825 | 53.4 | +5.5 |
| | Liberal Democrats | Matt Stanley | 1,115 | 32.6 | +2.2 |
| | Labour | Heather Robbins | 479 | 14.0 | +4.6 |
| Majority | | | |
| | Conservative hold | Swing | | |
East Preston and Ferring | Party | Candidate | Votes | % | ±% |
| | Conservative | Roger Elkins | 2,830 | 67.2 | −4.8 |
| | Labour | Steve McConnell | 437 | 10.4 | −1.0 |
| | Liberal Democrats | John Richards | 425 | 10.1 | −0.2 |
| | Green | Elizabeth Hammond | 380 | 9.0 | N/A |
| | For Britain | Karen Pearson | 139 | 3.3 | N/A |
| Majority | | | |
| | Conservative hold | Swing | | |
Felpham | Party | Candidate | Votes | % | ±% |
| | Conservative | John Charles | 1,642 | 52.4 | −12.5 |
| | Independent | Richard Parker | 629 | 20.1 | N/A |
| | Liberal Democrats | Samantha-Jayne Staniforth | 323 | 10.3 | +2.2 |
| | Green | Rebecca Rowland | 283 | 9.0 | +5.3 |
| | Labour | Lynne Armstrong | 256 | 8.2 | −0.3 |
| Majority | | | |
| | Conservative hold | Swing | | |
Fontwell | Party | Candidate | Votes | % | ±% |
| | Conservative | Trevor Bence | 1,618 | 49.9 | −13.8 |
| | Green | Paul Ayling | 1,157 | 35.7 | +25.5 |
| | Labour | Jane Mote | 353 | 10.9 | +2.6 |
| | For Britain | Jeannie Dunning | 80 | 2.5 | N/A |
| | TUSC | Sarah Welch | 37 | 1.1 | N/A |
| Majority | | | |
| | Conservative hold | Swing | | |
Littlehampton East | Party | Candidate | Votes | % | ±% |
| | Liberal Democrats | James Walsh | 1,575 | 46.6 | +1.8 |
| | Conservative | Mike Clayden | 1,283 | 38.0 | −2.5 |
| | Labour | Freddie Tandy | 318 | 9.4 | −1.7 |
| | Green | Joseph Downie | 203 | 6.0 | +2.3 |
| Majority | | | |
| | Liberal Democrats hold | Swing | | |
Littlehampton Town | Party | Candidate | Votes | % | ±% |
| | Conservative | David Britton | 971 | 37.2 | +5.1 |
| | Labour | Alan Butcher | 677 | 26.0 | +4.9 |
| | Liberal Democrats | William Tilbrook | 452 | 17.3 | −22.3 |
| | Independent | Ian Buckland | 307 | 11.8 | −27.8 |
| | Green | Lilias Cheyne | 200 | 7.7 | +2.8 |
| Majority | | | |
| | Conservative gain from Liberal Democrats | Swing | | |
Middleton | Party | Candidate | Votes | % | ±% |
| | Conservative | Jacky Pendleton | 1,799 | 55.4 | −10.4 |
| | Liberal Democrats | Amanda Worne | 1,024 | 31.5 | +23.5 |
| | Green | Helen Pengelly | 205 | 6.3 | +1.2 |
| | Labour | Berni Millam | 177 | 5.4 | −3.2 |
| | For Britain | Tricia Wales | 44 | 1.4 | N/A |
| Majority | | | |
| | Conservative hold | Swing | | |
Nyetimber | Party | Candidate | Votes | % | ±% |
| | Conservative | Dawn Hall | 1,489 | 44.5 | −13.0 |
| | Independent | David Huntley | 1,337 | 40.0 | N/A |
| | Green | Carol Birch | 309 | 9.2 | +3.1 |
| | Labour | David Meagher | 211 | 6.3 | −1.8 |
| Majority | | | |
| | Conservative hold | Swing | | |
Rustington | Party | Candidate | Votes | % | ±% |
| | Conservative | Alison Cooper | 2,629 | 64.6 | +21.3 |
| | Liberal Democrats | Jamie Bennett | 790 | 19.4 | −26.6 |
| | Labour | Nigel Stapley | 404 | 9.9 | +4.4 |
| | Green | Faye Mackenzie | 248 | 6.1 | N/A |
| Majority | | | |
| | Conservative gain from Liberal Democrats | Swing | | |
Chichester
Bourne | Party | Candidate | Votes | % | ±% |
| | Conservative | Mike Magill | 1,869 | 50.9 | +10.7 |
| | Liberal Democrats | Andrew Kerry-Bedell | 1,064 | 29.0 | +9.5 |
| | Green | Ann Stewart | 400 | 10.9 | +4.0 |
| | Labour | Jane Towers | 336 | 9.2 | +1.4 |
| Majority | | | |
| | Conservative hold | Swing | | |
Chichester East | Party | Candidate | Votes | % | ±% |
| | Conservative | Simon Oakley | 1,292 | 49.9 | +2.2 |
| | Liberal Democrats | David Betts | 657 | 25.4 | −3.6 |
| | Labour | Steve Gough | 641 | 24.7 | +9.9 |
| Majority | | | |
| | Conservative hold | Swing | | |
Chichester North | Party | Candidate | Votes | % | ±% |
| | Conservative | Jeremy Hunt | 2,035 | 51.7 | −4.3 |
| | Liberal Democrats | Charlie Hastain | 909 | 23.1 | +1.6 |
| | Green | George Hibberd | 497 | 12.6 | +5.7 |
| | Labour | Sarah Lishman | 497 | 12.6 | +3.9 |
| Majority | | | |
| | Conservative hold | Swing | | |
Chichester South | Party | Candidate | Votes | % | ±% |
| | Green | Sarah Sharp | 2,183 | 57.3 | +29.7 |
| | Conservative | Simon Lloyd-Williams | 1,189 | 31.2 | −16.5 |
| | Independent | Juliet Johnson | 204 | 5.4 | N/A |
| | Independent | Adam Brown | 179 | 4.7 | N/A |
| | Reform UK | Mark Crossman | 55 | 1.4 | N/A |
| Majority | | | |
| | Green gain from Conservative | Swing | | |
Chichester West | Party | Candidate | Votes | % | ±% |
| | Liberal Democrats | Julian Joy | 1,417 | 35.3 | +8.8 |
| | Conservative | Bob Hayes | 1,414 | 35.3 | −20.1 |
| | Independent | Gregory Fielder | 727 | 18.1 | N/A |
| | Labour | James Hobson | 420 | 10.5 | +3.4 |
| | Patria | Andrew Emerson | 32 | 0.8 | +0.3 |
| Majority | | | |
| | Liberal Democrats gain from Conservative | Swing | | |
Midhurst | Party | Candidate | Votes | % | ±% |
| | Liberal Democrats | Kate O'Kelly | 2,123 | 57.1 | +22.3 |
| | Conservative | Oliver Vickery | 1,436 | 38.6 | +5.2 |
| | Labour | Don Fraser | 159 | 4.3 | N/A |
| Majority | | | |
| | Liberal Democrats hold | Swing | | |
Petworth | Party | Candidate | Votes | % | ±% |
| | Conservative | Janet Duncton | 2,335 | 66.8 | −7.5 |
| | Liberal Democrats | Fred Lerche-Lerchenborg | 514 | 14.7 | −2.4 |
| | Green | Philip Maber | 335 | 9.6 | N/A |
| | Labour | Jonathan Rodell | 310 | 8.9 | N/A |
| Majority | | | |
| | Conservative hold | Swing | | |
Rother Valley | Party | Candidate | Votes | % | ±% |
| | Conservative | Tom Richardson | 2,105 | 61.7 | −7.8 |
| | Green | Tim Young | 651 | 19.1 | N/A |
| | Liberal Democrats | Jill Hilliard | 408 | 12.0 | −8.7 |
| | Labour | Juliette Reynolds | 250 | 7.3 | −2.5 |
| Majority | | | |
| | Conservative hold | Swing | | |
Selsey | Party | Candidate | Votes | % | ±% |
| | Local Alliance | Donna Johnson | 1,733 | 60.1 | +32.8 |
| | Conservative | David Shakespeare | 1,150 | 39.9 | −11.5 |
| Majority | | | |
| | Local Alliance gain from Conservative | | | |
The Witterings | Party | Candidate | Votes | % | ±% |
| | Conservative | Pieter Montyn | 2,187 | 65.0 | −3.5 |
| | Green | Lucinda House | 505 | 15.0 | +10.3 |
| | Liberal Democrats | Sue Milnes | 315 | 9.4 | −1.0 |
| | Labour | Susan Walsh | 309 | 9.2 | +0.6 |
| | For Britain | Pat Hunt | 48 | 1.4 | −6.5 |
| Majority | | | |
| | Conservative hold | Swing | | |
Crawley
Bewbush and Ifield West | Party | Candidate | Votes | % | ±% |
| | Labour | Chris Oxlade | 1,348 | 47.3 | +2.1 |
| | Conservative | Martin Stone | 1,038 | 36.4 | +1.4 |
| | Green | Richard Kail | 365 | 12.8 | +9.5 |
| | Liberal Democrats | Lawrence Mallinson | 98 | 3.4 | −1.9 |
| Majority | | | |
| | Labour hold | Swing | | |
Broadfield | Party | Candidate | Votes | % | ±% |
| | Labour | Brian Quinn | 1,539 | 52.5 | −2.4 |
| | Conservative | Craig Burke | 1,124 | 38.3 | +10.6 |
| | Liberal Democrats | Parveen Khan | 271 | 9.2 | +6.1 |
| Majority | | | |
| | Labour hold | Swing | | |
Langley Green and Ifield East | Party | Candidate | Votes | % | ±% |
| | Labour | Alison Cornell | 1,502 | 41.7 | −6.6 |
| | Conservative | Donald Butterfield | 1,340 | 37.2 | +0.8 |
| | Liberal Democrats | Naeem Shahzad | 511 | 14.2 | +9.3 |
| | Green | Iain Dickson | 245 | 6.8 | +3.6 |
| Majority | | | |
| | Labour hold | Swing | | |
Maidenbower & Worth | Party | Candidate | Votes | % | ±% |
| | Conservative | Bob Lanzer | 2,234 | 64.6 | −0.5 |
| | Labour | Carlos Castro | 762 | 22.0 | +4.1 |
| | Green | Sally-Claire Fadelle | 318 | 9.2 | +6.3 |
| | Liberal Democrats | Mike Sargent | 146 | 4.2 | −5.5 |
| Majority | | | |
| | Conservative hold | Swing | | |
Northgate & West Green | Party | Candidate | Votes | % | ±% |
| | Labour | Natalie Pudaloff | 1,309 | 43.6 | −5.8 |
| | Conservative | Jan Tarrant | 1,139 | 37.9 | +2.7 |
| | Independent | Karen Sudan | 320 | 10.6 | N/A |
| | Liberal Democrats | David Anderson | 237 | 7.9 | +2.9 |
| Majority | | | |
| | Labour hold | Swing | | |
Pound Hill | Party | Candidate | Votes | % | ±% |
| | Conservative | Richard Burrett | 1,645 | 60.1 | −5.9 |
| | Labour | Bob Noyce | 730 | 26.7 | +7.6 |
| | Green | Cyril Gambrell | 288 | 10.5 | +6.3 |
| | Liberal Democrats | Clive Trott | 74 | 2.7 | −4.4 |
| Majority | | | |
| | Conservative hold | Swing | | |
Southgate and Gossops Green | Party | Candidate | Votes | % | ±% |
| | Conservative | Zack Ali | 1,784 | 45.8 | +1.6 |
| | Labour | Michael Jones | 1,574 | 40.4 | −4.5 |
| | Green | Robin Fitton | 243 | 6.2 | +1.6 |
| | Liberal Democrats | Andrew Eastman | 203 | 5.2 | N/A |
| | Reform UK | Colin Thornback | 92 | 2.4 | N/A |
| Majority | | | |
| | Conservative gain from Labour | Swing | | |
Three Bridges | Party | Candidate | Votes | % | ±% |
| | Conservative | Brenda Burgess | 1,624 | 47.0 | +2.0 |
| | Labour | Linda Gregory | 1,412 | 40.9 | +7.0 |
| | Green | Danielle Kail | 283 | 8.2 | +4.1 |
| | Liberal Democrats | Paul Taylor-Burr | 136 | 3.9 | −1.8 |
| Majority | | | |
| | Conservative hold | Swing | | |
Tilgate and Furnace Green | Party | Candidate | Votes | % | ±% |
| | Conservative | Duncan Crow | 1,989 | 56.7 | −1.4 |
| | Labour | Colin Lloyd | 1,163 | 33.2 | +4.5 |
| | Green | Tom Coombes | 254 | 7.2 | +4.8 |
| | Liberal Democrats | Harry Old | 99 | 2.8 | −2.3 |
| Majority | | | |
| | Conservative hold | Swing | | |
Horsham
Billingshurst | Party | Candidate | Votes | % | ±% |
| | Conservative | Amanda Jupp | 2,051 | 53.0 | −10.3 |
| | Labour | Christopher Henson | 723 | 18.7 | +9.3 |
| | Liberal Democrats | Chris Geeson | 719 | 18.6 | +0.4 |
| | Green | Emma Rothwell | 375 | 9.7 | N/A |
| Majority | | | |
| | Conservative hold | Swing | | |
Bramber Castle | Party | Candidate | Votes | % | ±% |
| | Conservative | Paul Linehan | 1,669 | 43.2 | −10.6 |
| | Labour | Simon Birnstingl | 831 | 21.5 | +11.7 |
| | Green | Mike Croker | 762 | 19.7 | +12.1 |
| | Liberal Democrats | Nick Hopkinson | 603 | 15.6 | −10.2 |
| Majority | | | |
| | Conservative hold | Swing | | |
Broadbridge | Party | Candidate | Votes | % | ±% |
| | Conservative | Christian Mitchell | 1,837 | 51.2 | −6.7 |
| | Liberal Democrats | Belinda Walters | 1,010 | 28.1 | +5.8 |
| | Green | Catherine Ross | 434 | 12.1 | +5.7 |
| | Labour | Joanne Kavanagh | 307 | 8.6 | +1.0 |
| Majority | | | |
| | Conservative hold | Swing | | |
Henfield | Party | Candidate | Votes | % | ±% |
| | Conservative | Sarah Payne | 2,117 | 53.3 | −17.1 |
| | Labour | Fiona Ayres | 944 | 23.8 | +10.4 |
| | Green | Celia Emmott | 608 | 15.3 | N/A |
| | Liberal Democrats | David Epps | 303 | 7.6 | −8.6 |
| Majority | | | |
| | Conservative hold | Swing | | |
Holbrook | Party | Candidate | Votes | % | ±% |
| | Conservative | Andrew Baldwin | 1,660 | 45.8 | −17.1 |
| | Liberal Democrats | Ruth Fletcher | 1,537 | 42.4 | +21.6 |
| | Labour | Ray Chapman | 431 | 11.9 | +1.9 |
| Majority | | | |
| | Conservative hold | Swing | | |
Horsham East | Party | Candidate | Votes | % | ±% |
| | Liberal Democrats | Jay Mercer | 1,490 | 41.2 | +8.1 |
| | Conservative | Ross Dye | 1,388 | 38.4 | −10.0 |
| | Labour | Gerard Kavanagh | 433 | 12.0 | +3.7 |
| | Green | Ferial MacTavish | 302 | 8.4 | +4.3 |
| Majority | | | |
| | Liberal Democrats gain from Conservative | Swing | | |
Horsham Hurst | Party | Candidate | Votes | % | ±% |
| | Liberal Democrats | Nigel Dennis | 2,406 | 59.6 | +6.9 |
| | Conservative | David Thompson | 1,012 | 25.1 | −6.9 |
| | Labour | Carol Hayton | 617 | 15.3 | +3.4 |
| Majority | | | |
| | Liberal Democrats hold | Swing | | |
Horsham Riverside | Party | Candidate | Votes | % | ±% |
| | Liberal Democrats | John Milne | 1,653 | 46.0 | +2.4 |
| | Conservative | Tony Hogben | 1,244 | 34.6 | −2.3 |
| | Labour | David Hide | 489 | 13.6 | +3.1 |
| | Peace | Jim Duggan | 208 | 5.8 | +2.6 |
| Majority | | | |
| | Liberal Democrats hold | Swing | | |
Pulborough | Party | Candidate | Votes | % | ±% |
| | Conservative | Charlotte Kenyon | 2,303 | 57.8 | −7.9 |
| | Green | Jon Campbell | 577 | 14.5 | N/A |
| | Liberal Democrats | Alex Beveridge | 546 | 13.7 | −3.6 |
| | Labour | Nick Dalton | 440 | 11.0 | +1.4 |
| | For Britain | Jo Hughes | 118 | 3.0 | N/A |
| Majority | | | |
| | Conservative hold | Swing | | |
Southwater & Nuthurst | Party | Candidate | Votes | % | ±% |
| | Conservative | Nigel Jupp | 1,807 | 49.2 | −5.9 |
| | Liberal Democrats | Nick Grant | 1,112 | 30.3 | +5.1 |
| | Green | Morag Warrack | 422 | 11.5 | +4.7 |
| | Labour | Kevin O'Sullivan | 330 | 9.0 | +2.2 |
| Majority | | | |
| | Conservative hold | Swing | | |
St Leonards Forest | Party | Candidate | Votes | % | ±% |
| | Conservative | Katie Nagel | 1,418 | 54.6 | −7.5 |
| | Liberal Democrats | Sam Raby | 787 | 30.3 | +12.8 |
| | Labour | Sara Loewenthal | 394 | 15.2 | +4.9 |
| Majority | | | |
| | Conservative hold | Swing | | |
Storrington | Party | Candidate | Votes | % | ±% |
| | Conservative | Paul Marshall | 2,594 | 56.9 | −5.1 |
| | Green | Claudia Fisher | 1,294 | 28.4 | N/A |
| | Labour | James Ross | 420 | 9.2 | −0.6 |
| | Liberal Democrats | Ian Miles | 250 | 5.5 | −14.8 |
| Majority | | | |
| | Conservative hold | Swing | | |
Mid Sussex
Burgess Hill East | Party | Candidate | Votes | % | ±% |
| | Liberal Democrats | Richard Cherry | 1,726 | 43.0 | +12.7 |
| | Conservative | Anne Jones | 1478 | 36.9 | −4.4 |
| | Labour | Sue Jex | 386 | 9.6 | −1.0 |
| | Green | Ann Pearce | 327 | 8.2 | +4.2 |
| | Reform UK | Terence Gibbs | 93 | 2.3 | N/A |
| Majority | 248 | 6.1 | 3.7 |
| | Liberal Democrats gain from Conservative | Swing | | |
Burgess Hill North | Party | Candidate | Votes | % | ±% |
| | Liberal Democrats | Stuart Condie | 1,448 | 40.9 | +26.8 |
| | Conservative | Andrew Barrett-Miles | 1,354 | 38.2 | −2.0 |
| | Green | Bob Foster | 398 | 11.2 | +7.5 |
| | Labour | Pam Haigh | 342 | 9.7 | −4.0 |
| Majority | | | |
| | Liberal Democrats gain from Conservative | Swing | | |
Cuckfield and Lucastes | Party | Candidate | Votes | % | ±% |
| | Conservative | Pete Bradbury | 1,740 | 46.1 | −11.1 |
| | Liberal Democrats | Alison Rees | 759 | 20.1 | −4.7 |
| | Labour | Paul Kenny | 586 | 15.5 | +5.5 |
| | Green | Allan Murray | 548 | 14.5 | +6.5 |
| | Reform UK | Richard Rap | 144 | 3.8 | N/A |
| Majority | | | |
| | Conservative hold | Swing | | |
East Grinstead Meridian | Party | Candidate | Votes | % | ±% |
| | Conservative | Liz Bennett | 1,532 | 54.4 | −10.7 |
| | Independent | Norman Mockford | 357 | 12.7 | N/A |
| | Liberal Democrats | Andrew Lane | 350 | 12.4 | +1.2 |
| | Labour | David Wilbraham | 300 | 10.7 | −1.9 |
| | Green | Alexandra Langridge | 276 | 9.8 | +3.5 |
| Majority | | | |
| | Conservative hold | Swing | | |
East Grinstead South & Ashurst Wood | Party | Candidate | Votes | % | ±% |
| | Conservative | Jacquie Russell | 1,699 | 51.8 | −4.0 |
| | Liberal Democrats | Amanda Clark | 806 | 24.6 | +1.4 |
| | Green | Laura Buonocore | 389 | 11.9 | +3.0 |
| | Labour | Stephen Pritchard | 292 | 8.9 | +1.7 |
| | Reform UK | Dave MacQuire | 92 | 2.8 | N/A |
| Turnout | | | |
| | Conservative hold | Swing | | |
Hassocks and Burgess Hill South | Party | Candidate | Votes | % | ±% |
| | Liberal Democrats | Kirsty Lord | 2,818 | 61.9 | +23.0 |
| | Conservative | Alexander Simmons | 1,184 | 26.0 | −12.4 |
| | Labour | Fred Burns | 551 | 12.1 | −1.7 |
| Majority | | | |
| | Liberal Democrats hold | Swing | | |
Haywards Heath East | Party | Candidate | Votes | % | ±% |
| | Conservative | Stephen Hillier | 1,493 | 49.1 | −2.4 |
| | Labour | Richard Whiting | 623 | 20.5 | +2.5 |
| | Liberal Democrats | George Smith | 468 | 15.4 | −1.7 |
| | Green | Deanna Nicholson | 457 | 15.0 | +9.2 |
| Majority | | | |
| Turnout | | | |
| | Conservative hold | Swing | | |
Haywards Heath Town | Party | Candidate | Votes | % | ±% |
| | Conservative | Sujan Wickremaratchi | 1,375 | 37.8 | −10.0 |
| | Liberal Democrats | Stephanie Inglesfield | 1,257 | 34.5 | +2.1 |
| | Labour | Gregory Mountain | 553 | 15.2 | +0.7 |
| | Green | Michael Miller | 365 | 10.0 | +4.7 |
| | Democratic Network | Jonathan Lea | 90 | 2.5 | N/A |
| Majority | | | |
| | Conservative hold | Swing | | |
Hurstpierpoint and Bolney | Party | Candidate | Votes | % | ±% |
| | Conservative | Joy Dennis | 1,774 | 41.0 | −8.7 |
| | Liberal Democrats | Fiona Jackson | 1,482 | 34.2 | +7.4 |
| | Green | Nick Dearden | 534 | 12.3 | +4.7 |
| | Labour | Alison Whelan | 418 | 9.7 | −1.1 |
| | Monster Raving Loony | Baron von Thunderclap | 122 | 2.8 | +1.7 |
| Majority | | | |
| | Conservative hold | Swing | | |
Imberdown | Party | Candidate | Votes | % | ±% |
| | Independent | Ian Gibson | 1,843 | 53.1 | +21.1 |
| | Conservative | Norman Webster | 1,286 | 37.1 | −10.7 |
| | Labour | Daniel Everett | 316 | 9.1 | +3.0 |
| | For Britain | Barry Noldart | 25 | 0.7 | N/A |
| Majority | | | |
| | Independent gain from Conservative | Swing | | |
Lindfield and High Weald | Party | Candidate | Votes | % | ±% |
| | Conservative | Garry Wall | 2,016 | 43.9 | −14.6 |
| | Liberal Democrats | Anne-Marie Cooke | 1,393 | 30.3 | +14.5 |
| | Green | David Woolley | 779 | 17.0 | +4.0 |
| | Labour | Tim Weekes | 403 | 8.8 | −0.5 |
| Majority | | | |
| | Conservative hold | Swing | | |
Worth Forest | Party | Candidate | Votes | % | ±% |
| | Conservative | Bruce Forbes | 2,082 | 57.5 | −7.1 |
| | Green | Jenny Edwards | 798 | 22.1 | +15.0 |
| | Liberal Democrats | Cavan Wood | 363 | 10.0 | −3.9 |
| | Independent | Carole Steggles | 292 | 8.1 | N/A |
| | Reform UK | Dominic Moorhouse | 83 | 2.3 | N/A |
| Majority | | | |
| | Conservative hold | Swing | | |
Worthing
Broadwater | Party | Candidate | Votes | % | ±% |
| | Labour | Dawn Smith | 1,631 | 45.8 | +12.1 |
| | Conservative | Bryan Turner | 1,410 | 39.6 | −2.4 |
| | Green | Richard Battson | 309 | 8.7 | +2.3 |
| | Liberal Democrats | John Apsey | 215 | 6.0 | −5.9 |
| Majority | | | |
| | Labour gain from Conservative | Swing | | |
Cissbury | Party | Candidate | Votes | % | ±% |
| | Conservative | Elizabeth Sparkes | 2,320 | 64.8 | −1.1 |
| | Labour | Ibsha Choudhury | 550 | 15.4 | +4.9 |
| | Green | Julie Dawe | 347 | 9.7 | +5.0 |
| | Liberal Democrats | Iona Harte | 323 | 9.0 | −3.7 |
| | For Britain | Mick Clark | 38 | 1.1 | N/A |
| Majority | | | |
| | Conservative hold | Swing | | |
Durrington and Salvington | Party | Candidate | Votes | % | ±% |
| | Conservative | Noel Atkins | 1,736 | 56.2 | +5.1 |
| | Labour | Helen Silman | 648 | 21.0 | +8.2 |
| | Liberal Democrats | Emma Norton | 449 | 14.5 | −6.2 |
| | Green | James Darrall | 255 | 8.3 | +3.8 |
| Majority | | | |
| | Conservative hold | Swing | | |
Goring | Party | Candidate | Votes | % | ±% |
| | Conservative | Steve Waight | 1,949 | 57.5 | −3.8 |
| | Labour | Jim Deen | 784 | 23.1 | +9.2 |
| | Green | Trevor Hopkins | 440 | 13.0 | +6.8 |
| | Liberal Democrats | Robin Rogers | 214 | 6.3 | −5.0 |
| Majority | | | |
| | Conservative hold | Swing | | |
Northbrook | Party | Candidate | Votes | % | ±% |
| | Conservative | Sean McDonald | 1,507 | 49.7 | −0.1 |
| | Labour | Ingrid Allan | 930 | 30.6 | +16.8 |
| | Liberal Democrats | Nick Wiltshire | 342 | 11.3 | −8.3 |
| | Green | Joe Pearce | 256 | 8.4 | +3.3 |
| Majority | | | |
| | Conservative hold | Swing | | |
Tarring | Party | Candidate | Votes | % | ±% |
| | Labour | Henna Chowdhury | 1,221 | 31.3 | +16.4 |
| | Conservative | Edward Crouch | 1,193 | 30.5 | −4.3 |
| | Liberal Democrats | Hazel Thorpe | 1,114 | 28.5 | −9.9 |
| | Green | Stephen Carleysmith | 301 | 7.7 | +2.5 |
| | Libertarian | Marco Di Paola | 78 | 2.0 | N/A |
| Majority | | | |
| | Labour gain from Liberal Democrats | Swing | | |
Worthing East | Party | Candidate | Votes | % | ±% |
| | Labour | Caroline Baxter | 1,669 | 48.6 | +11.1 |
| | Conservative | Alex Harman | 1,154 | 33.6 | −4.8 |
| | Green | Jo Paul | 392 | 11.4 | +4.6 |
| | Liberal Democrats | Yvonne Leonard | 217 | 6.3 | −4.5 |
| Majority | | | |
| | Labour gain from Conservative | Swing | | |
Worthing Pier | Party | Candidate | Votes | % | ±% |
| | Labour | John Turley | 1,276 | 39.2 | +8.1 |
| | Conservative | Michael Cloake | 1,185 | 36.4 | −0.8 |
| | Green | Ian Davey | 558 | 17.1 | −2.1 |
| | Liberal Democrats | Christine Brown | 236 | 7.3 | 0.0 |
| Majority | | | |
| | Labour gain from Conservative | Swing | | |
Worthing West | Party | Candidate | Votes | % | ±% |
| | Labour | Beccy Cooper | 1,824 | 46.4 | +24.5 |
| | Conservative | Paul High | 1,540 | 39.1 | −12.5 |
| | Green | Sonya Mallin | 285 | 7.2 | −1.3 |
| | Liberal Democrats | Jacqueline Cranefield | 171 | 4.3 | −7.7 |
| | Independent | Christopher Woodward | 114 | 2.9 | N/A |
| Majority | | | |
| | Labour gain from Conservative | Swing | | |
By-elections
Bourne
Bourne: 4 November 2021 | Party | Candidate | Votes | % | ±% |
| | Liberal Democrats | Andrew Kerry-Bedell | 1,180 | 51.8 | +22.8 |
| | Conservative | Bob Hayes | 893 | 39.2 | −11.7 |
| | Green | Ann Stewart | 178 | 7.8 | −3.1 |
| | Labour | Alan Butcher | 25 | 1.1 | −8.1 |
| Majority | 287 | 12.6 | |
| Turnout | 2,281 | 22.5 | |
| | Liberal Democrats gain from Conservative | Swing | 17.3 | |
Worthing West
Worthing West: 7 July 2022 | Party | Candidate | Votes | % | ±% |
| | Labour | Graham McKnight | 1,262 | 52.0 | +5.6 |
| | Conservative | Michael Cloake | 795 | 32.8 | –6.3 |
| | Liberal Democrats | Hazel horpe | 235 | 9.7 | +5.4 |
| | Green | Joanne Paul | 133 | 5.5 | –1.7 |
| Majority | 467 | 19.2 | |
| Turnout | 2,433 | 27.0 | |
| Registered electors | 9,019 | | |
| | Labour hold | Swing | 6.0 | |
Felpham
Felpham: 8 September 2022 | Party | Candidate | Votes | % | ±% |
| | Independent | Jaine Wild | 803 | 43.4 | N/A |
| | Conservative | David Darling | 733 | 39.6 | –12.8 |
| | Labour | David Meagher | 217 | 11.7 | +3.5 |
| | Independent | Richard Parker | 99 | 5.3 | –14.8 |
| Majority | 70 | 3.8 | |
| Turnout | 1,857 | 19.2 | |
| Registered electors | 9,664 | | |
| | Independent gain from Conservative | Swing | N/A | |
References
- ^ "election". West Sussex County Council. Archived from the original on 13 February 2020. Retrieved 3 February 2021.
- ^ "Elections 2021: Conservatives hold Sussex county councils". BBC News. 9 May 2021. Retrieved 9 May 2021.

 8
8  1
1 
 Council elections in West Sussex


