2000 English local election
2000 Bassetlaw District Council election
|
| ← 1999 | 4 May 2000 (2000-05-04) | 2002 → |
|
One third of seats to Bassetlaw District Council (50 seats)
26 seats needed for a majority |
|---|
| Turnout | 23.5% |
|---|
| | First party | Second party | Third party | | | Lab | Con | LD | | Party | Labour | Conservative | Liberal Democrats | | Seats won | 11 | 5 | 1 | | Seats after | 31 | 14 | 3 | | Percentage | 45.4% | 41.8% | 9.3% | |
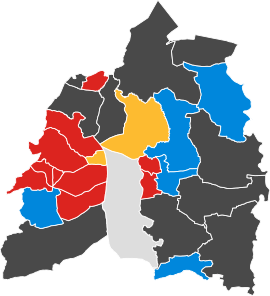 No election Colours denote the winning party, as shown in the main table of results. |
Council control before election
Labour
| Council control after election
Labour
| |
The 2000 Bassetlaw District Council election took place on 4 May 2000 to elect one third of the members of Bassetlaw District Council in Nottinghamshire, England as part of the 2000 United Kingdom local elections.[1]
Election result
One third of seats (17 seats) were up for election with one councillor elected per ward with the exception of East Retford West ward, where two seats were elected due to a by-election being combined with the ordinary election.[2]
The Labour Party won a majority of seats and retained control of the council.
| Overall result |
| Party | Seats
(2000) | Seats
(Council) | Seats
(Change) |
| | Labour | 11 | 31 | |
| | Conservative | 5 | 14 | |
| | Liberal Democrats | 1 | 3 | |
| | Independent | 1 | 2 | |
| Registered electors | 63,573 |
| Votes cast | 14,933 |
| Turnout | 23.5% |
Ward results
Beckingham
Beckingham (1) | Party | Candidate | Votes | % | ±% |
| | Conservative | Kenneth Bullivant | 454 | 76.8% | |
| | Labour | Robert Payne | 137 | 23.2% | |
| Turnout | 596 | 31.7% | |
| Registered electors | 1,878 | | |
Carlton
Carlton (1) | Party | Candidate | Votes | % | ±% |
| | Labour | Alastair Williams | 618 | 51.4% | |
| | Conservative | Edward Banks | 585 | 48.6% | |
| Turnout | 1,205 | 26.2% | |
| Registered electors | 4,605 | | |
Clayworth
Clayworth (1) | Party | Candidate | Votes | % | ±% |
| | Conservative | Irene Balding | 427 | 77.8% | |
| | Labour | Geoffrey Chapman | 122 | 22.2% | |
| Turnout | 553 | 34.7% | |
| Registered electors | 1,595 | | |
East Retford East
East Retford East (1) | Party | Candidate | Votes | % | ±% |
| | Conservative | Wendy Quigley | 1,048 | 52.7% | |
| | Liberal Democrats | Elizabeth Dobbie | 573 | 28.8% | |
| | Labour | Pamela Cook | 366 | 18.4% | |
| Turnout | 1,351 | 35.0% | |
| Registered electors | 5,679 | | |
East Retford North
East Retford North (1) | Party | Candidate | Votes | % | ±% |
| | Labour | Pamela Skelding | 700 | 51.6% | |
| | Conservative | Gordon Morley | 657 | 48.4% | |
| Turnout | 1,351 | 25.2% | |
| Registered electors | 5,354 | | |
East Retford West
East Retford West (2) | Party | Candidate | Votes | % | ±% |
| | Labour | Michael Storey | 655 | 48.7% | |
| | Labour | Philip Skelding | 607 | | |
| | Liberal Democrats | John Bragger | 467 | 34.7% | |
| | Liberal Democrats | David Dobbie | 450 | | |
| | Conservative | Heather Taylor | 223 | 16.6% | |
| | Conservative | Maureen Trigg | 207 | | |
| Turnout | 1,304 | 24.4% | |
| Registered electors | 5,354 | | |
Elkesley
Elkesley (1) | Party | Candidate | Votes | % | ±% |
| | Independent | Stanley Moody | Unopposed |
Harworth East
Harworth East (1) | Party | Candidate | Votes | % | ±% |
| | Labour | Margaret Muskett | 269 | 57.8% | |
| | Independent Labour | George Burchby | 155 | 33.3% | |
| | Independent | William Macaulay | 41 | 8.8% | |
| Turnout | 469 | 17.4% | |
| Registered electors | 2,703 | | |
Hodsock
Hodsock (1) | Party | Candidate | Votes | % | ±% |
| | Labour | Gill Freeman | 298 | 72.0% | |
| | Conservative | Derrick Connolly | 116 | 28.0% | |
| Turnout | 419 | 22.4% | |
| Registered electors | 1,873 | | |
Sutton
Sutton (1) | Party | Candidate | Votes | % | ±% |
| | Liberal Democrats | Alan Kitchen | 406 | 62.4% | |
| | Conservative | Norman Myers | 245 | 37.6% | |
| Turnout | 654 | 38.3% | |
| Registered electors | 1,707 | | |
Tuxford
Tuxford (1) | Party | Candidate | Votes | % | ±% |
| | Conservative | Keith Isard | 329 | 50.9% | |
| | Labour | Marilyn McCarthy | 318 | 49.1% | |
| Turnout | 651 | 34.1% | |
| Registered electors | 1,912 | | |
Worksop East
Worksop East (1) | Party | Candidate | Votes | % | ±% |
| | Labour | James Elliott | 635 | 64.7% | |
| | Independent | Matthew Keywood | 346 | 35.3% | |
| Turnout | 985 | 21.3% | |
| Registered electors | 4,625 | | |
Worksop North
Worksop North (1) | Party | Candidate | Votes | % | ±% |
| | Labour | Roy Barsley | 579 | 61.4% | |
| | Conservative | Carole Mangham | 364 | 38.6% | |
| Turnout | 952 | 18.6% | |
| Registered electors | 5,106 | | |
Worksop North East
Worksop North East (1) | Party | Candidate | Votes | % | ±% |
| | Labour | Janet Pimperton | 573 | 50.0% | |
| | Conservative | Philip Bird | 572 | 50.0% | |
| Turnout | 1,155 | 22.0% | |
| Registered electors | 5,252 | | |
Worksop North West
Worksop North West (1) | Party | Candidate | Votes | % | ±% |
| | Labour | David Pressley | 645 | 65.1% | |
| | Conservative | Richard Durr | 346 | 34.9% | |
| Turnout | 996 | 21.5% | |
| Registered electors | 4,627 | | |
Worksop South
Worksop South (1) | Party | Candidate | Votes | % | ±% |
| | Conservative | Andrew Dibb | 912 | 62.4% | |
| | Labour | Charles Espin | 549 | 37.6% | |
| Turnout | 1,468 | 22.6% | |
| Registered electors | 6,501 | | |
Worksop South East
Worksop South East (1) | Party | Candidate | Votes | % | ±% |
| | Labour | Brian Hopkinson | 598 | 72.9% | |
| | Conservative | Juliana Smith | 222 | 27.1% | |
| Turnout | 824 | 17.2% | |
| Registered electors | 4,802 | | |
References
- ^ "Local Elections 2000". BBC News.
- ^ Colin Rallings and Michael Thrasher, The Elections Centre, Plymouth University. "Bassetlaw 1973-2012". electionscentre.co.uk. Retrieved 27 April 2023.
{{cite web}}: CS1 maint: multiple names: authors list (link)


 Council elections in Nottinghamshire


